I remember when Stripe launched Stripe Radar, their machine learning-powered fraud prevention tool in 2016. The team tested it with early customers like Watsi and Teespring, closely monitored usage, and iterated quickly on features and rules.
Marketing, sales, product, and engineering worked together to refine messaging, streamline onboarding, and ensure customers quickly understood Radar’s value.
Each pilot and adjustment fed into campaigns, onboarding flows, and sales materials, turning Radar into a product that not only prevented billions in fraud but also became a major driver of adoption and revenue in Stripe’s payments ecosystem.
Teams that achieve results like this follow a clear system for go to market execution. In this guide, you will learn the REV-CORE Framework, a seven-pillar approach to building that system, and receive six ready-to-use templates your team can start applying today.
We put together a 15 minute self-assessment that scores you across 7 areas: content, outbound, lead qualification, distribution, operations, team capacity, and ICP clarity. Find out where the gaps are and where to focus first.
What Is Go to Market Execution?
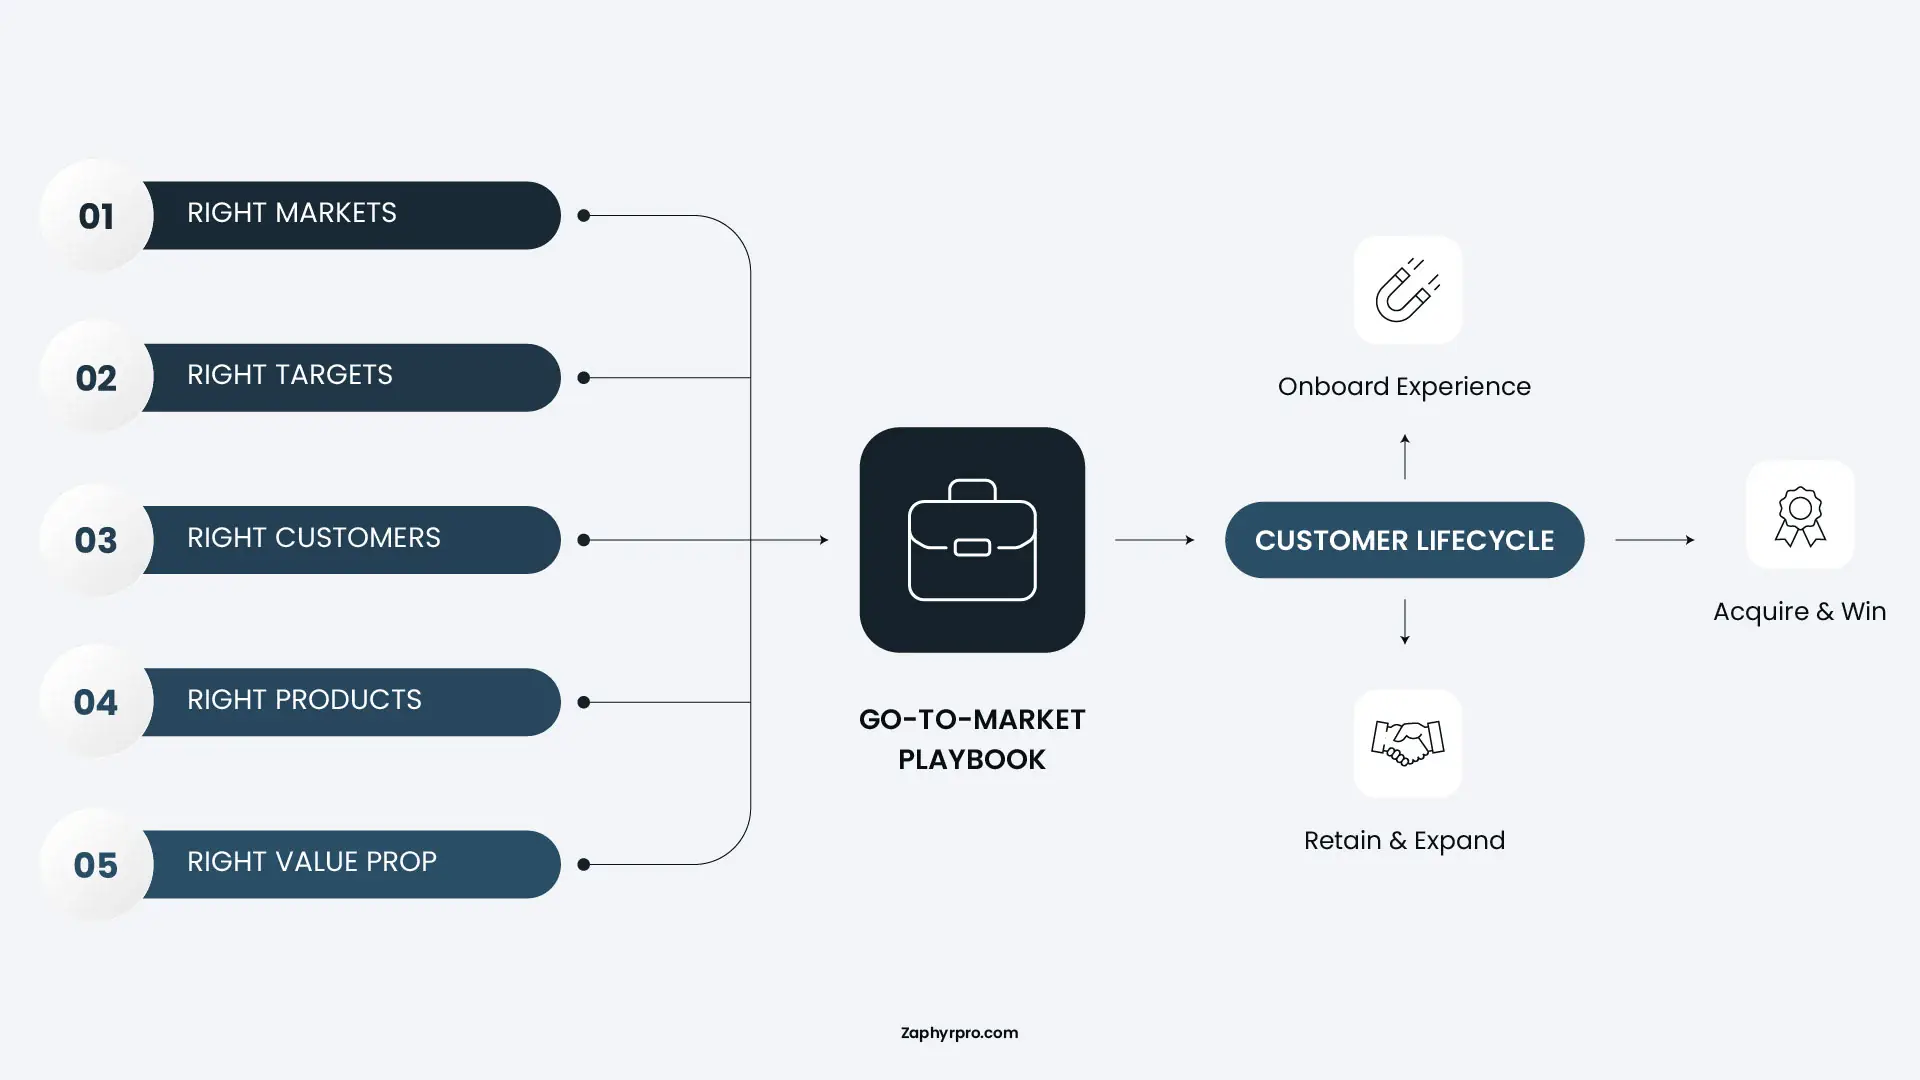
Go-to-Market execution is the operationalization of a GTM strategy. It is the systematic deployment of capital, talent, and channels to move an Ideal Customer Profile (ICP) through the funnel from initial awareness to closed-won revenue. While strategy is the hypothesis, execution is the validated repeatable motion.
For a B2B SaaS company targeting finance firms, GTM execution involves syncing LinkedIn ads with sales outreach sequences, ensuring the value proposition matches the prospect’s specific pain points (e.g., compliance or efficiency), and tracking conversion rates at every stage of the funnel.
Now that we’ve defined go to market execution, let’s look at how it differs from strategy because knowing the difference is key to getting results.
Strategy vs. Execution: Why They’re Not the Same
Many companies confuse strategy with execution. Strategy answers what we’re trying to achieve and why it matters. Execution answers who will do it, how, and by when.
- A polished Ideal Customer Profile (ICP) deck doesn’t automatically generate leads.
- A positioning workshop doesn’t move deals forward.
To put this into perspective, think of it like building a car, strategy designs the engine, execution is what puts fuel in it and drives it down the road.
Just to compare GTM strategy with go to market execution:
| Dimension | GTM Strategy | GTM Execution |
|---|---|---|
|
Focus |
Direction and positioning |
Actions and outcomes |
|
Timeframe |
6–18 month horizon |
Weekly and monthly sprints |
|
Owners |
Founders, VP Marketing, VP Sales |
Revenue Ops, Demand Gen, Marketers |
|
Key outputs |
ICP definition, messaging, channel mix |
Pipeline, CAC, win rate, sales velocity |
|
Failure mode |
Wrong market, wrong product-market fit |
Misalignment, poor execution rhythm, no feedback loop |
|
Measured by |
Market share, ARR targets |
MQLs, SQLs, conversion rates, revenue |
Here are six facts about go to market execution and why they matter
If strategy were the primary problem, you’d expect companies to struggle with vision. Instead, they struggle with coordination, follow-through, and alignment.
For example:
- Misaligned sales and marketing costs B2B companies 10% or more of revenue every year. That’s $100 million for a billion-dollar company. And yet, only 8% of companies have strong alignment between their sales and marketing departments.
(Source: ZoomInfo)
- 79% of marketing leads never convert into sales. The main culprit is a failure to nurture those leads after they come in. Most teams spend too much time generating leads and not enough time building the follow-up process that actually closes them.
(Source: HubSpot)
- When marketing and sales work together, pipeline conversion jumps by 65%. Across all alignment levels, marketing’s involvement consistently boosts conversions from target buying groups to pipeline regardless of how tight the hand-off process is.
(Source: Influ2, 2025)
- 60–70% of B2B content created by marketing is never used by sales. In most cases, it goes unused because the topic is irrelevant to the actual buyer. This is a direct execution failure when messaging isn’t built around a real ICP, the content misses.
(Source: LXA Hub)
- Top-performing B2B SaaS companies reach 1,000 subscribers in 11 months. The median company takes 2 years. What separates them isn’t just a better product, it’s sharper go to market execution.
(Source: ChartMogul Go-To-Market Report)
- Companies with strong sales and marketing alignment grow 19% faster and are 15% more profitable. They also save 30% on customer acquisition costs and see at least a 20% boost in lifetime value. Whereas, poor alignment companies see a 4% revenue decline year over year.
(Source: Forrester)
Step-by-Step: How to Build a Go-to-Market Execution Plan
A go-to-market execution plan is a structured process that defines who you sell to, how you reach them, what you say, and how you measure results. This section breaks it into seven steps with clear actions, common mistakes, and metrics for each stage.
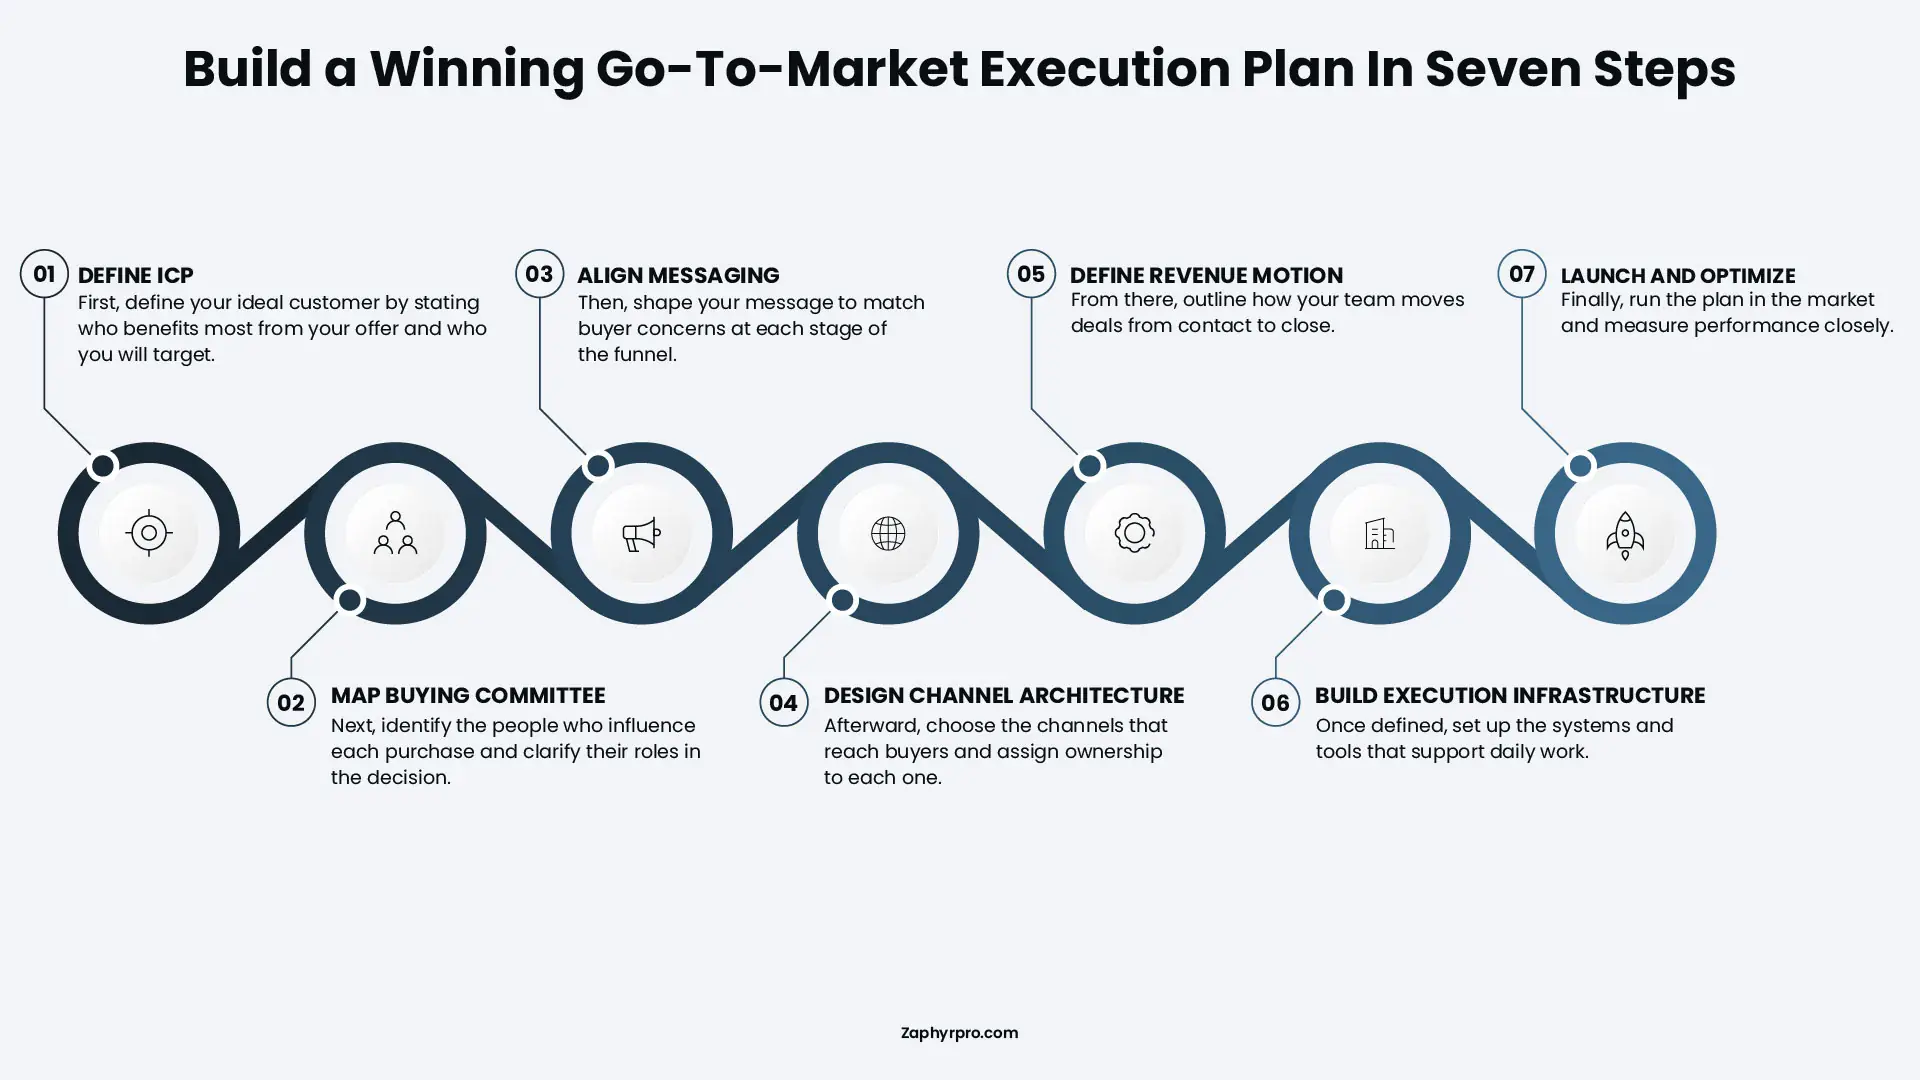
Step 1: Define Your Ideal Customer Profile (ICP)
Your Ideal Customer Profile (ICP) is a clear description of the type of company most likely to buy, realize value, and remain a long-term customer. Unlike a persona, which focuses on an individual, an ICP focuses on the company.
To define your ICP, analyze your best existing customers and identify patterns across these five dimensions:
- Firmographics: Company size, industry, revenue range, and location.
- Technographics: Tools and platforms they currently use. Companies using complementary technologies or platforms your product integrates with are often a stronger fit.
- Buying Signals: Indicators that suggest readiness to purchase. For example, new hiring in relevant roles, recent funding, or market expansion.
- Budget & Authority: Ensure the company can afford your solution, and that your primary contacts have decision-making authority.
- Pain Profile: The specific problems they are trying to solve and the urgency behind them.
📌 PRO TIP: Document your ICP in a single-page reference and use it to score every lead in your pipeline for alignment and prioritization.
Metrics to Track
- ICP match rate: What percentage of your pipeline fits your defined ICP?
- Win rate by ICP segment: Do ICP-fit deals close at a higher rate?
- Average sales cycle length by segment
- Retention rate by ICP segment
Step 2: Map the Buying Committee
Most B2B purchases involve multiple decision-makers. The buying committee is the group of people within a target company who influence, approve, or block a purchase. Understanding and mapping this group is critical to winning deals.
For each deal, identify these four primary roles:
- The economic buyer: The person who approves the budget. They focus on ROI, risk, and alignment with company priorities. Engaging them early is crucial.
- The champion: Your internal advocate who actively supports your product. This is typically your main contact and can influence others in the organization.
- The end user: The individual(s) who will use your product daily. They care about usability and whether it effectively solves their problem.
- The blocker: Stakeholders such as Legal, IT, Procurement, or Finance. Their role is to identify risks and potentially slow or stop the purchase. Ignoring them can lead to late-stage deal losses.
📌 PRO TIP: Map the buying committee for each ICP segment. A 50-person company’s committee looks very different from that of a 500-person company, so tailor your engagement strategy accordingly.
Metrics to Track
- Number of stakeholders engaged per deal
- Win rate when economic buyer is involved early vs. not
- Deal velocity by number of stakeholders engaged
- Late-stage loss rate due to internal blockers
Step 3: Align Messaging to Funnel Stages
Different buyers need different buyer intent data depending on where they are in the buying process. Messaging that works at the awareness stage will not work when someone is ready to make a decision.
Break your marketing funnel into three stages and define what each stage needs:
- Top of funnel (awareness): The buyer knows they have a problem but may not know a solution exists. Content here should name the problem clearly and help them understand it better. Strategize and plan b2b blog strategy, research data, and short-form video.
- Middle of funnel (consideration): The buyer is evaluating options. Content here should show how your approach works, why it is different, and what results it produces. Think case studies, comparison guides, and product walkthroughs.
- Bottom of funnel (decision): The buyer is close to choosing. Content here should reduce risk and make the decision easy. Think free trials, ROI calculators, customer references, and clear pricing information.
📌 PRO TIP: Assign specific content assets and sales talk tracks to each stage. Ensure your sales team knows what to share, with whom, and when to maximize engagement and conversions.
Step 4: Design Channel Architecture
Channel architecture defines which channels you will use to reach your ICP, how those channels work together, and how budget and effort are allocated across them. Start by identifying where your ICP actually spends time and how they prefer to learn about new solutions. Then choose channels across two categories:
- Inbound channels bring buyers to you. This includes SEO, content marketing, paid search, social media, and referrals. These take longer to build but produce compounding results over time.
- Outbound channels involve your team reaching out directly. This includes cold email, LinkedIn outreach, cold calling, and direct mail. These produce results faster but require more ongoing effort.
📌 PRO TIP: Most companies need a mix of both. A common starting point for a B2B company is two outbound channels and one or two inbound channels. Run them for 90 days before drawing conclusions about performance.
Also define how channels hand off to each other. A buyer might discover you through a blog post, get retargeted with a paid ad, then receive an outbound email from a rep. That sequence should be intentional, not accidental.
Metrics to Track
- Pipeline generated by channel
- Cost per qualified lead by channel
- Conversion rate from each channel to closed revenue
- Channel attribution across multi-touch journeys
Step 5: Define Your Revenue Motion
Your revenue motion describes how your company sells. It defines whether buyers come to you or you go to them, and what the sales experience looks like from first contact to closed deal. There are three main revenue motions. Choose the one that fits your product and price point:
- Product-led growth (PLG): The product itself drives acquisition. Buyers sign up, use the product, and upgrade when they hit limits or see enough value. This works best for products with low friction to start and a clear moment where paid features become necessary.
- Sales-led growth: A sales team drives acquisition through direct conversations. Every deal involves a rep. This works best for complex products with higher price points where buyers need guidance to evaluate and implement.
- Marketing-led growth: Content, brand, and campaigns generate demand that flows into sales. The buyer is often partially educated before a rep ever speaks to them. This works well when your buyers do significant research before purchasing.
📌 PRO TIP: Most companies use a combination. For example, a sales-led motion supported by marketing that warms leads before they reach sales often produces the best results.
Once you pick your motion, define the stages of your sales process, what happens at each stage, and what criteria move a deal from one stage to the next.
Metrics to Track
- Pipeline conversion rate by stage
- Average deal size
- Average sales cycle length
- Revenue by motion type if running more than one
Step 6: Build Execution Infrastructure
Execution infrastructure is the combination of tools, processes, and documentation that allows your GTM plan to run consistently and at scale.
Companies often rely on specialized roles, including a GTM Engineer, to set up automation, integrations, and reporting so that marketing, sales, and revenue operations can work seamlessly together.
Four areas to build out before you launch:
- CRM setup: Your CRM should reflect your sales process. Stage names, required fields, and pipeline views should match how your team actually sells. If reps have to struggle in the CRM to log activity, they will stop using it.
- Sales playbook: Document your sales process, talk tracks for each funnel stage, common objections and responses, and the criteria for moving deals forward. This does not need to be long. A clear, practical document that reps actually use is better than a 50 page guide that ends up forgotten in a folder.
- Reporting structure: Define what you will measure, who owns each metric, and how often you review performance. Weekly pipeline reviews, monthly funnel analysis, and quarterly strategy reviews are a reasonable starting structure.
- Onboarding and enablement: How will new sales and marketing hires get up to speed? If the answer is “they shadow someone for a week,” you do not have a process. You have a dependency on one person.
Metrics to Track
- CRM data completion rate
- Time from lead to first contact
- Ramp time for new sales hires
- Percentage of deals that follow the documented sales process
Step 7: Launch, Measure, Optimize
This is where the plan meets the market. Launch is not a single moment. It is an ongoing cycle of running the plan, measuring what happens, and making improvements based on real data. Structure your launch in 30-day blocks for the first 90 days:
- Days 1 to 30: Focus on activity. Are reps sending outreach? Is content going live? Are leads flowing into the pipeline? The goal is execution.
- Days 31 to 60: Focus on early signals. Are leads responding to outreach? Which channels are generating the most activity? Are meetings being booked? Look for patterns in what is working and what is not.
- Days 61 to 90: Focus on conversion. Are meetings converting to qualified opportunities? Are qualified opportunities moving to proposals? Where are deals stalling? This is where you start making process changes based on data.
📌 PRO TIP: After 90 days, run a full review. Look at every stage of the funnel, identify the biggest drop-off points, and prioritize one or two improvements to make in the next cycle for go to market execution.
Metrics to Track
- Leads generated by channel and week
- Meeting booked rate from outreach
- Qualified opportunity conversion rate
- Pipeline value created vs. target
- Win rate and average deal size
- Time from first contact to closed deal
- Monthly recurring revenue added
Go to Market Execution Plan Templates You Can Use
Keep your launch organized with a go-to-market execution template. These six resources walk you through the entire execution lifecycle, starting with product-market fit and ending with your sales and distribution channel strategy.
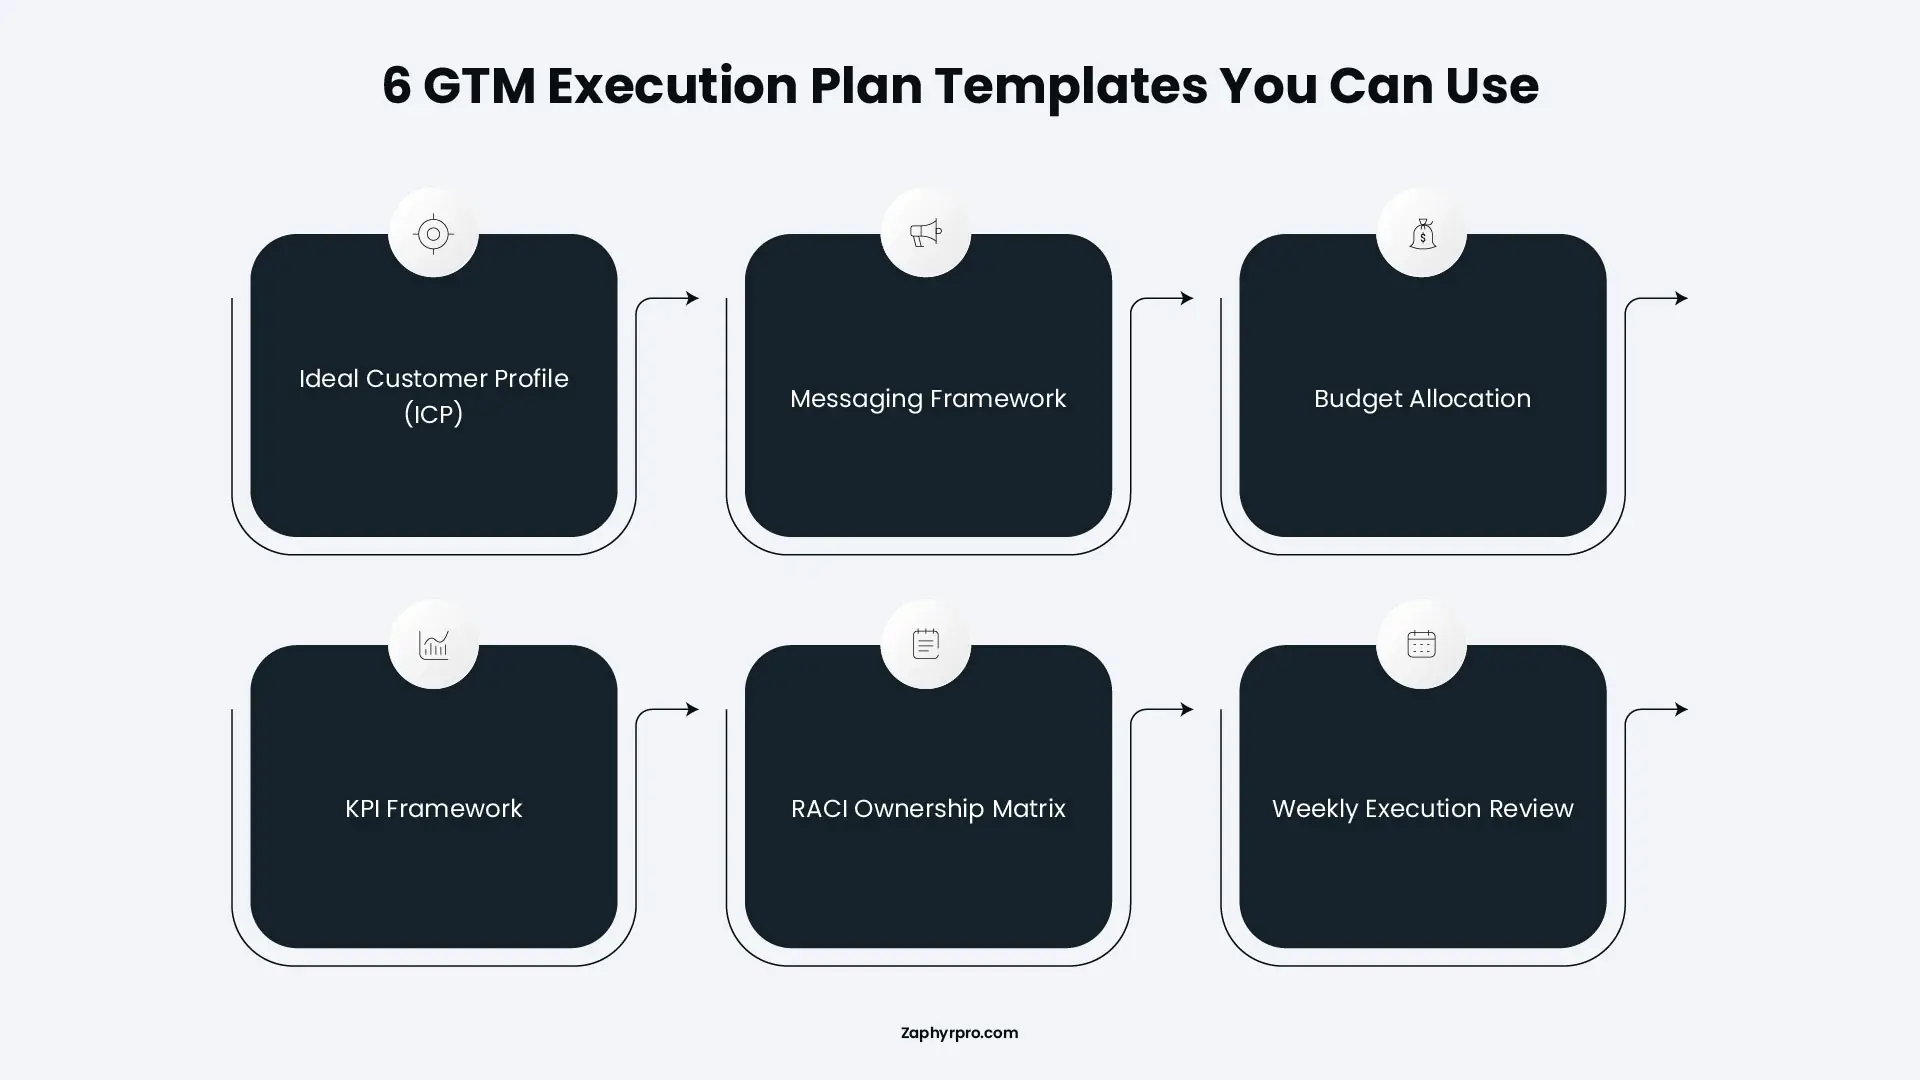
Template 1: Ideal Customer Profile (ICP)
It walks you through five areas: firmographics (company size, industry, revenue range), technographics (what tools they already use), buying signals (events that indicate they are ready to buy), pain profile (what problem they are trying to solve and how urgently), and disqualifiers (criteria that remove a lead from your pipeline immediately).
Who it is for: Sales leaders, founders, and demand gen teams building or refining their ICP for the first time.
Template 2: Messaging Framework
It gives you a structured way to define your core value proposition, map your messaging to each stage of the funnel, prepare responses to the six most common objections, and track the proof assets you have available at each stage.
Who it is for: Marketing teams, content strategists, and sales managers who want their team speaking the same language.
Template 3: Budget Allocation
This template includes a budget overview section, a category-by-category breakdown with automatic annual calculations and percentage-of-total formulas, and a separate budget vs. actual tracker so you can see variance in real time.
Who it is for: GTM leads, marketing directors, and founders who need to plan and track spending across multiple channels.
Template 4: KPI Framework
It organizes your GTM metrics into three categories: pipeline and revenue KPIs (MRR, win rate, deal size, sales cycle), activity and top-of-funnel KPIs (outreach sent, reply rate, meetings booked), and customer and retention KPIs (churn rate, CAC, LTV, NRR).
Each metric has a column for your target, this month, last month, and a vs. target formula that calculates automatically. Every metric also has an owner column so accountability is built in from the start.
Who it is for: Revenue leaders, sales managers, and ops teams who want one shared view of GTM performance.
Template 5: RACI Ownership Matrix
This template maps 15 core GTM activities across five roles using the RACI model. R means the person does the work. A means they own the outcome. C means their input is needed. I mean they are kept informed. Each cell is color-coded so the matrix is readable at a glance.
It also includes a role definitions section where you assign names to each role, and a legend so anyone new to the team can understand the matrix in under a minute.
Who it is for: GTM leads, operations managers, and anyone running a cross-functional sales and marketing team.
Template 6: Weekly Execution Review
It includes a weekly scorecard with nine key metrics and automatic vs. target calculations, a timed six-item agenda with clear owners for each section, an action log with priority and status tracking, and a monthly review add-on with six additional items to cover once per month.
Who it is for: GTM leads and team managers who want a repeatable weekly operating rhythm that keeps execution sharp.
The 7 Pillars of Effective Go to Market Execution: The REV-CORE Framework
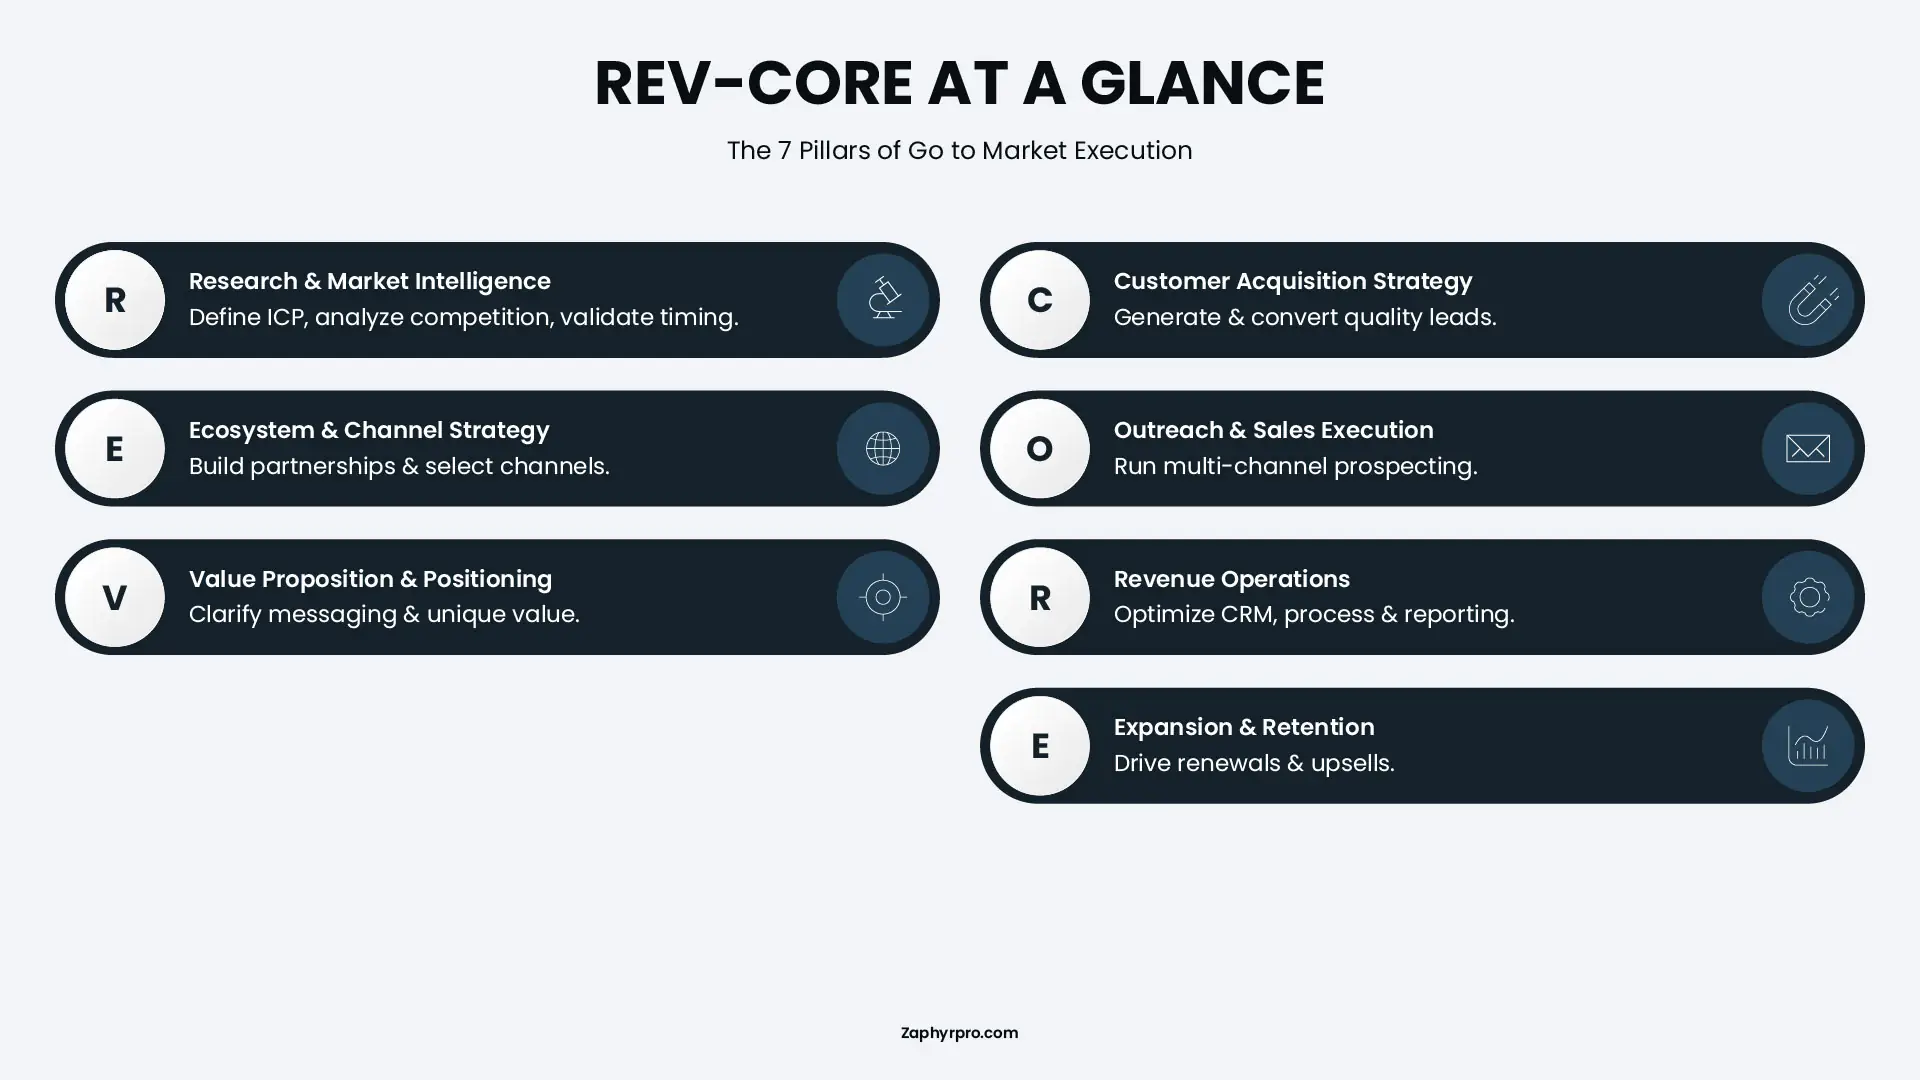
To achieve consistent growth, organizations must adopt a structured approach. The REV-CORE Framework provides a foundation for scaling B2B SaaS motions. This section breaks down each of the seven pillars, what they mean, and how to apply them for go to market execution.
Pillar 1: Research and Market Intelligence
Before you write any copy or hire any salespeople, you need to know exactly who you are selling to and why they would pay for your solution. Most teams either skip this step or do it once and never revisit it. That is a mistake.
Strong market research answers three specific questions:
- Who is your ideal customer? Not a general description. A precise definition that includes company size, industry, budget range, the specific problem they are trying to solve, and what would trigger them to start looking for a solution right now.
- What does the competitive market look like from the buyer’s perspective? This is not just listing your top competitors. It means understanding why buyers choose them, where those competitors fall short, and what gap you can credibly own.
- Is the timing right? Budget cycles, industry trends, and external pressures all affect when buyers are ready to act. Understanding market timing helps you enter conversations at the right moment.
If you cannot answer these three questions with evidence rather than assumptions, the rest of your go to market execution plan is built on a weak foundation.
Pillar 2: Ecosystem and Channel Strategy
Choosing the right channels to reach your ideal customers and building the right partnerships to multiply your reach. There are two types of channels to consider:
- Direct channels are the ones your team owns and operates. This includes outbound sales, inbound marketing, paid advertising, SEO, and content marketing. You fund these directly and control how they perform.
- Indirect channels are partnerships that expand your distribution without requiring you to do all the work. This includes resellers, referral partners, integration partners, and marketplace listings.
Many early-stage companies focus entirely on direct channels because they feel more in control. But companies that grow quickly often build partnerships early. The right partner can bring you in front of hundreds of qualified buyers that would have taken you years to reach on your own.
The right channel mix depends on your product, your price point, and where your buyers already spend time. A self-serve product at a low price point needs different channels than a high-value enterprise deal.
A practical starting point is to pick two or three channels, execute them well, and expand from there once you have data on what works.
Pillar 3: Value Proposition and Positioning
A value proposition is a clear, specific statement that explains who your product is for, what problem it solves, and why a buyer should choose you over any alternative.Positioning is not about being creative. It is about being specific. Here is the difference between weak and strong positioning:
- Weak: “We help businesses improve operational efficiency through an AI-powered platform.”
- Strong: “We help mid-market sales teams reduce CRM admin time by 50% so their reps spend more time selling.”
The second version names a specific buyer, a specific problem, and a specific result. A reader knows immediately whether it applies to them.
Strong positioning does three things consistently: It speaks to a real problem that the buyer already feels. It makes a clear and believable claim about the result. And it signals who the product is for, which also signals who it is not for.
Positioning also needs to stay consistent across every channel. If your website says one thing and your sales team says something different, buyers get confused. Confused buyers do not move forward which also affects your go to market execution.
Pillar 4: Customer Acquisition Strategy
A customer acquisition strategy defines how you bring qualified buyers into your pipeline consistently. It covers four areas:
- Lead generation: How are you filling the top of the funnel? This could be outbound prospecting, inbound content, events, referrals, or partnerships. Each source has different volume, cost, and quality characteristics.
- Lead qualification: How do you quickly determine whether a lead is worth pursuing? Without a clear qualification framework, your sales team wastes time on buyers who will never convert.
- Sales motion: Are you asking buyers to try the product before they buy? Or does every deal require a live conversation and a proposal? The answer shapes how you staff, what you say, and how long your sales cycle takes.
- Conversion process: What does the path from first contact to signed agreement look like? Where do deals typically slow down or stop? Mapping this process reveals where to focus your improvement efforts.
One common mistake here is optimizing for lead volume over lead quality. A large pipeline full of poor-fit prospects is worse than a small pipeline full of well-qualified ones. It drains your team and produces unreliable forecasts.
Pillar 5: Outreach and Sales Execution
This is where your strategy meets real buyers. Outreach and sales execution covers how your team conducts prospecting, runs sales conversations, and moves deals forward. Three things separate strong outreach from average outreach:
1. Relevance
Generic outreach gets ignored. Buyers can tell in three seconds whether a message was written for them or copied and pasted. Effective outreach references something specific: a trigger event, a problem common to their industry, or something relevant to their role. This does not require writing every message from scratch. It requires building templates with specific variables that make each message feel personal.
2. Follow-up across multiple channels
Email alone is rarely enough. Most buyers need to see your name more than once before they respond. A structured sequence that uses email outreach, LinkedIn, and phone together performs better than relying on any one channel.
3. Fast handoffs between marketing and sales
One of the most common breakdowns in go to market execution happens when a lead comes in and nobody follows up quickly. Research consistently shows that response time is one of the strongest predictors of whether an inbound lead converts. Define the handoff process clearly and measure how long it takes.
Pillar 6: Revenue Operations
Revenue operations, often shortened to RevOps, is the combination of systems, data, and processes that support your sales and marketing motion. It is the infrastructure underneath everything else.
When it works well, you can answer questions like:
- Where in the sales process are we losing the most deals?
- Which channels produce customers who stay the longest?
- How long does it take to close a deal by customer segment?
- Which activities correlate most closely with won deals?
When it does not work, no one agrees on the numbers, the CRM has inaccurate or missing data, and decisions get made on instinct rather than evidence.
Four components that matter most for go to market execution:
- CRM accuracy: A CRM is only as valuable as the accuracy of its data. To maintain that accuracy, assign clear ownership, run regular reviews, and enforce consistent field usage across teams.
- Tech stack alignment: Do your sales tools and marketing tools share data? Are leads flowing from one system to the next without getting lost? Gaps in your tech stack create gaps in your pipeline.
- Shared reporting: Every team involved in revenue growth needs to look at the same numbers. Multiple reports that contradict each other lead to arguments about the data instead of conversations about the business.
- Documented processes: If the way your team executes only exists in someone’s memory, you have a scale problem. Written playbooks make it possible to train new hires, identify what is working, and improve over time.
Pillar 7: Expansion and Retention
Growing revenue from existing customers through renewals, upsells, and expanded usage, rather than depending entirely on new customer acquisition. New customer acquisition is expensive.
Expanding an existing account that already trusts you costs less and often closes faster. For most subscription businesses, the math behind long-term growth depends heavily on keeping customers and growing them.
Two things to focus on here:
- Retention: Are your customers actually getting value from your product? Retaining customers requires more than answering support tickets. It means proactively checking in, tracking whether they are using the product, measuring the outcomes they care about, and stepping in before they decide to leave.
- Expansion revenue: When a customer is seeing real value, there is usually an opportunity to grow the account. This could be through additional seats, a higher-tier plan, or a related service. Knowing when to have that conversation, who to have it with, and what to offer makes a meaningful difference in how much revenue you generate from your existing base.
The metric to track here is Net Revenue Retention. NRR measures the percentage of revenue retained from existing customers after accounting for churn, downgrades, and expansion.
An NRR above 100% means your existing customer base is growing even without any new customers. That is the financial foundation that makes scaling a business significantly easier with go to market execution.
Common Go to Market Execution Mistakes
Based on analysis of hundreds of failed product launches and market entries, here are the most common go to market execution mistakes that companies make, categorized by where they occur in the process.
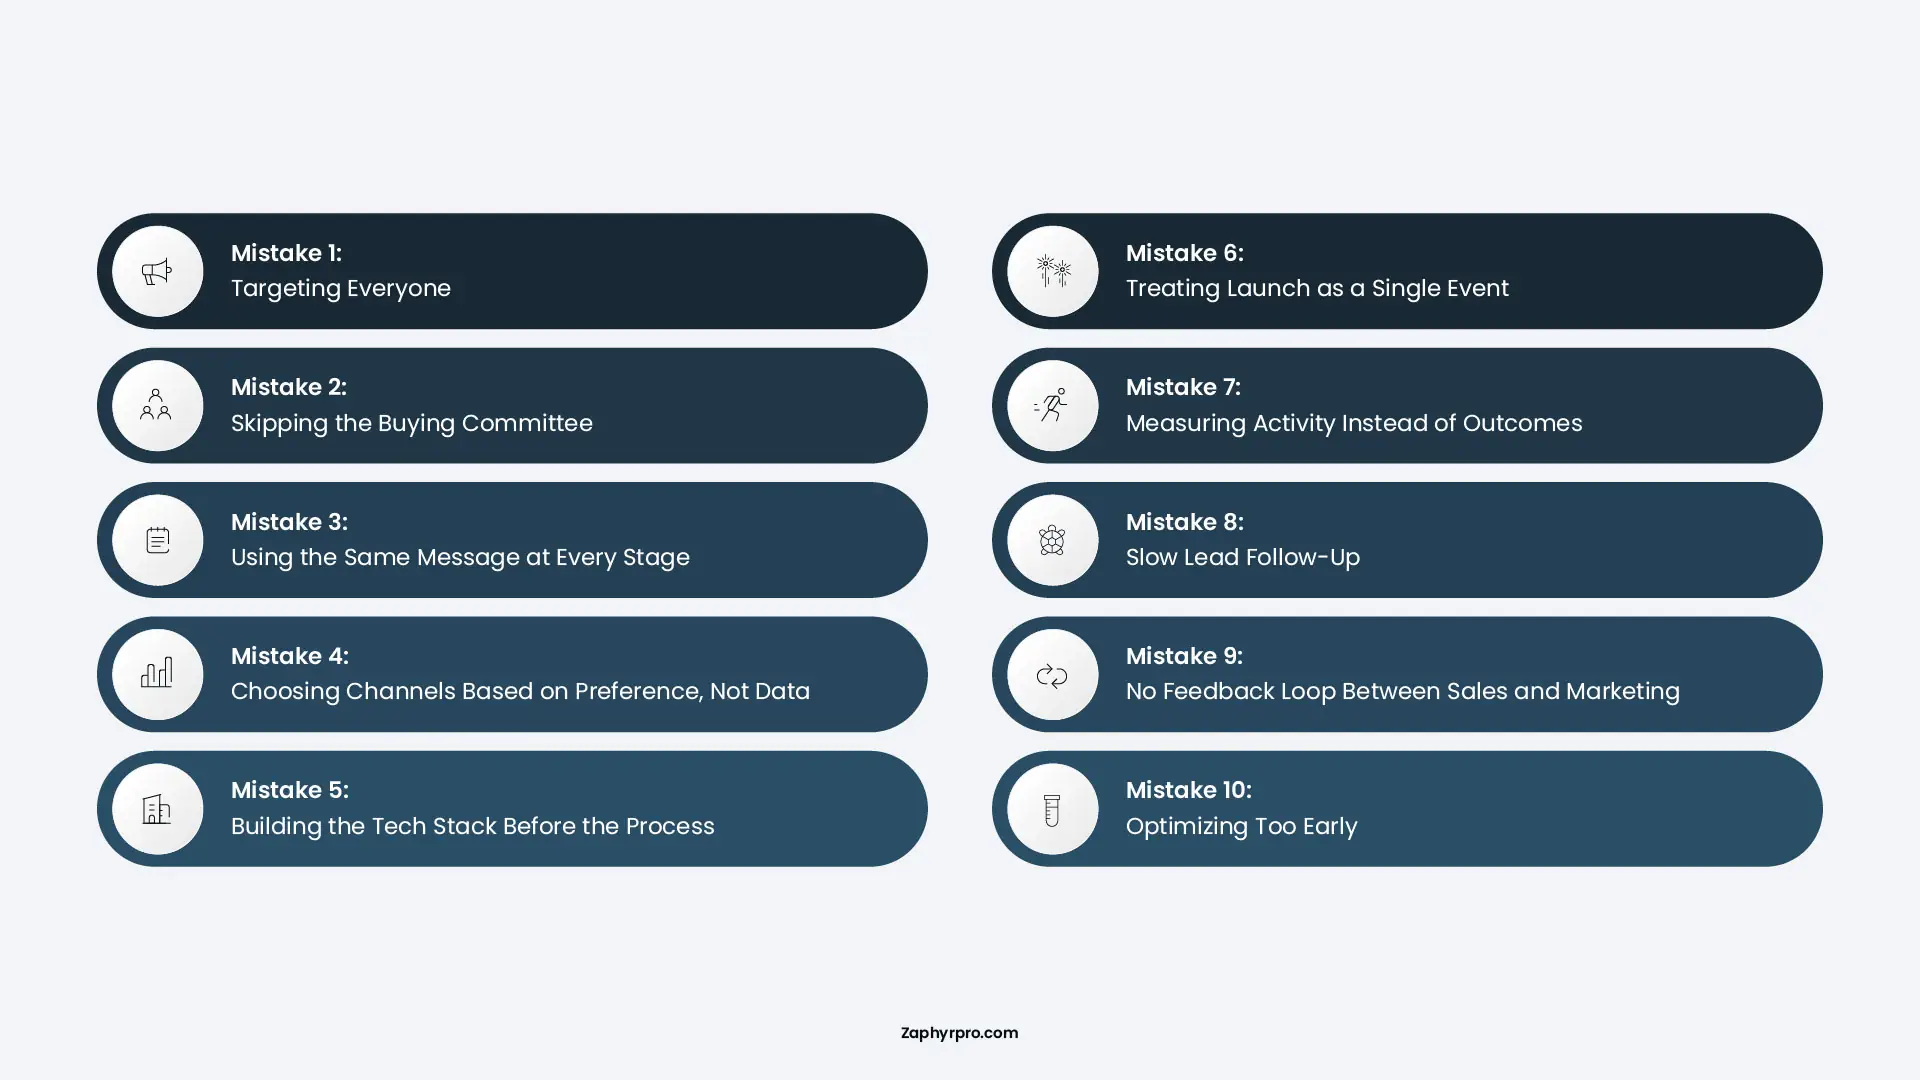
Mistake 1: Targeting Everyone
When your ICP is too broad, your messaging becomes vague, your channels become unfocused, and your sales team wastes time on leads that will never convert. The more specific your target, the better everything else performs. Narrowing your focus is not limiting. It is what makes growth possible.
Mistake 2: Skipping the Buying Committee
Selling to one person inside a company and assuming they can close the deal alone is one of the most common reasons deals die late in the process. Most B2B purchases involve three to six stakeholders. If you are not building relationships across that group early, someone you have never spoken to can block the deal at the final stage.
Mistake 3: Using the Same Message at Every Stage
A buyer who just became aware of a problem needs different information than a buyer who is comparing vendors. Sending a pricing page to someone still trying to understand the problem pushes them away. Map your content and talk tracks to where the buyer actually is in the process.
Mistake 4: Choosing Channels Based on Preference, Not Data
Teams often invest heavily in the channels they are most comfortable with rather than the ones their buyers actually use. If your ICP does not spend time on LinkedIn, investing heavily in LinkedIn will not produce results regardless of how much content you create. Let buyer behavior guide channel selection, not internal preference.
Mistake 5: Building the Tech Stack Before the Process
Buying tools before you have a clear sales process is one of the most expensive mistakes a go to market execution team can make. Tools should support a process that already works. When you buy tools first and try to build processes around them, you end up with expensive software that nobody uses consistently.
Mistake 6: Treating Launch as a Single Event
A product launch is not a moment. It is the beginning of an ongoing go to market execution cycle. Teams that treat launch as a finish line stop iterating too early. The companies that grow consistently treat every 30 to 90 days as a new cycle of running, measuring, and improving.
Mistake 7: Measuring Activity Instead of Outcomes
Tracking the number of emails sent or calls made can feel productive while producing nothing. Activity metrics matter only as inputs. What matters is what that activity produces: conversations started, meetings booked, qualified opportunities created, and deals closed. Build your reporting around outcomes, not effort.
Mistake 8: Slow Lead Follow-Up
Research consistently shows that the speed of follow-up is one of the strongest predictors of whether an inbound lead converts. Waiting 24 to 48 hours to respond to someone who showed interest means you are often following up after they have already moved forward with someone else. Define response time standards and hold the team to them.
Mistake 9: No Feedback Loop Between Sales and Marketing
Marketing generates leads based on assumptions about what the market wants. Sales speaks to buyers every day and hears what they actually care about. When those two teams do not share information regularly, marketing keeps producing content that misses the mark and sales keeps complaining about lead quality. A regular feedback loop between the two teams fixes this faster than any tool or process change.
Mistake 10: Optimizing Too Early
Changing your messaging, channels, and outreach approach all at once when early results are disappointing is a common reaction that makes things worse. You cannot learn what is working if you change everything at the same time. Run your plan for at least 60 to 90 days before making significant changes, and change one variable at a time so you can actually measure the effect.
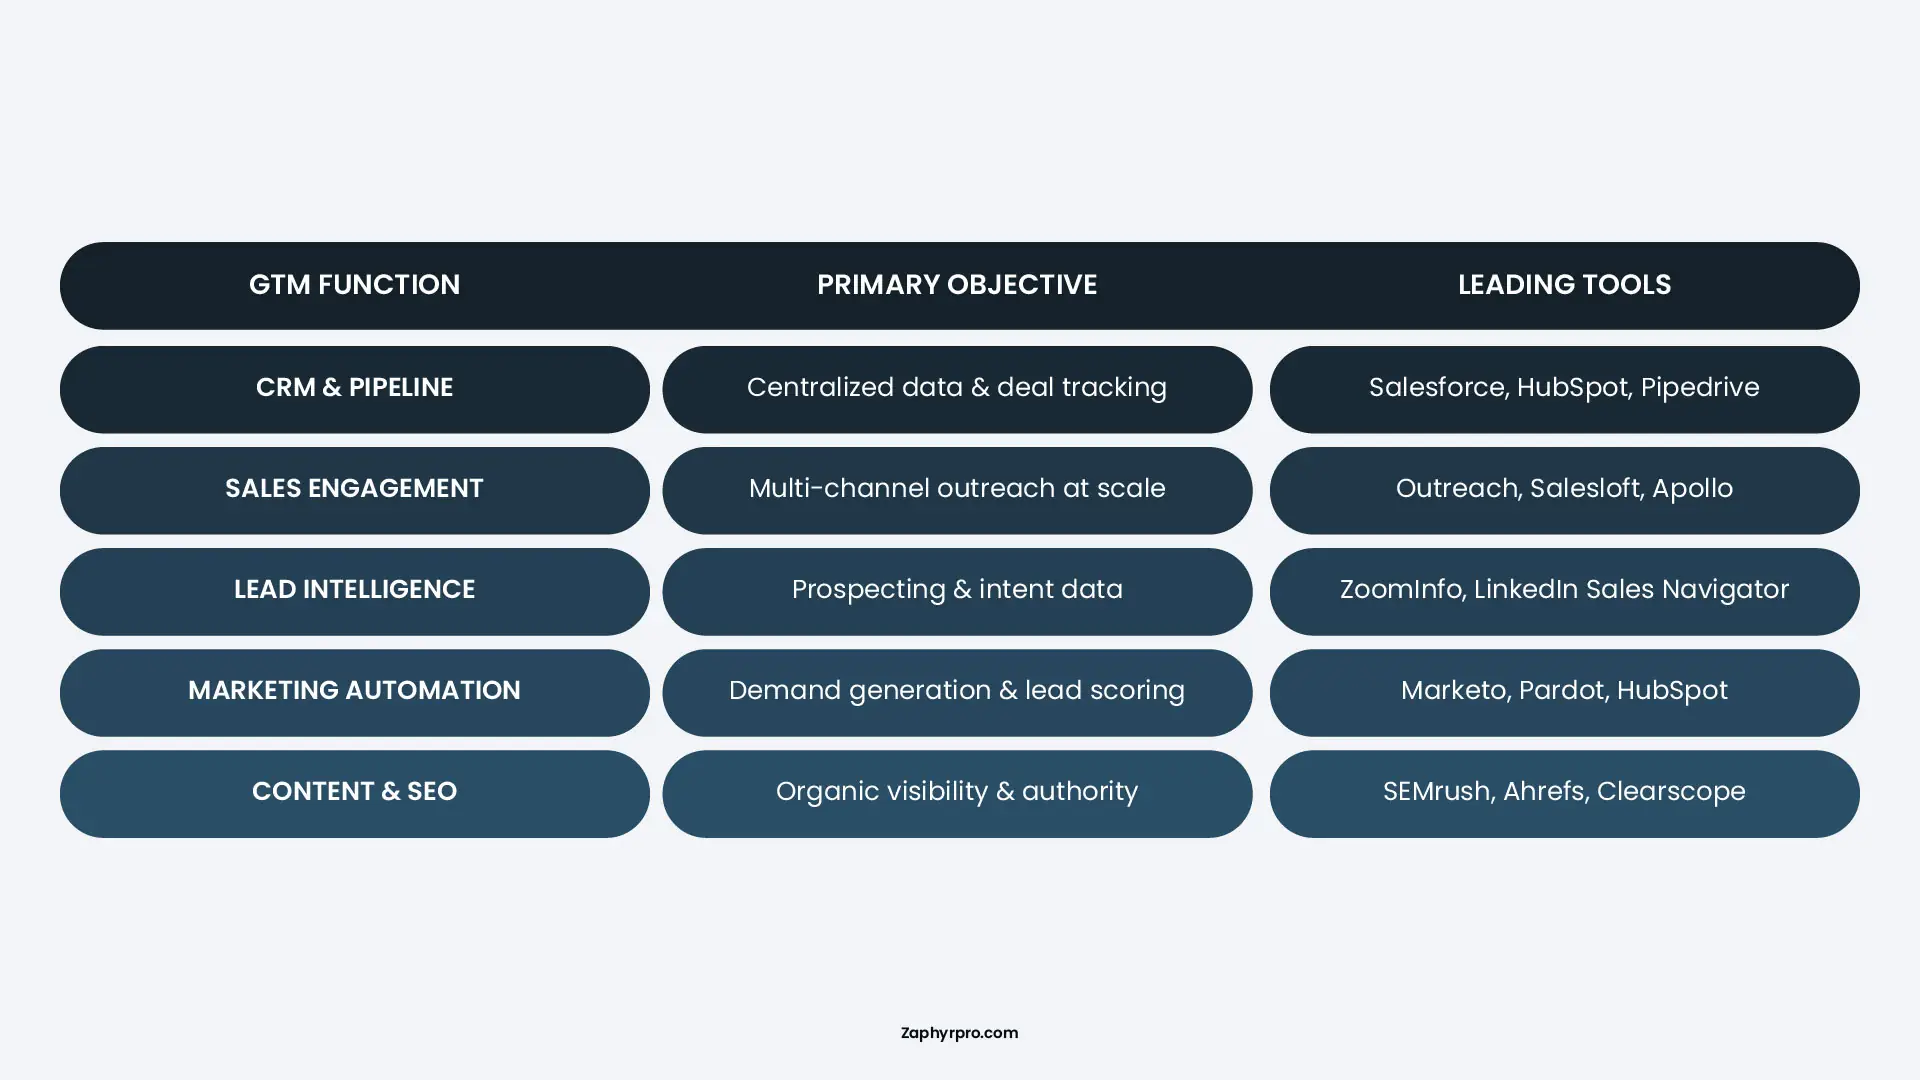
What Tools Do You Need for Go-to-Market Execution?
A modern Go-to-Market (GTM) tech stack is a suite of integrated software tools designed to automate, measure, and optimize the customer acquisition and retention lifecycle. A complete go to market execution stack covers seven essential functions:
Final Thoughts
If you have read this far, you already have more structure than most teams that are struggling with go to market execution. The next step is putting it into practice, and that is where most of the real learning happens.
If you want help building or reviewing your GTM execution plan, whether that is defining your ICP, building out your channel strategy, or figuring out why pipeline is not converting the way it should, we would be glad to take a look with you.
Schedule a free consultation with us today to have a conversation about where you are and what might help.
Frequently Asked Questions
A go-to-market execution plan is a structured document that defines who you sell to, how you reach them, what you say at each stage, and how you measure results. It is the operational layer that sits underneath your GTM strategy and turns it into day-to-day actions your team can follow. Without it, strategy stays on a slide deck and never gets executed consistently.
A basic plan covering ICP, messaging, channel selection, and sales process takes most teams two to four weeks to build properly. A full execution infrastructure including CRM setup, playbooks, and reporting takes six to eight weeks. The timeline depends on how much existing customer data you have and how aligned your team already is on who you are selling to.
Defining your Ideal Customer Profile is the foundation everything else depends on. If your ICP is wrong or too broad, your messaging will miss, your channels will underperform, and your sales team will waste time on leads that will never convert. Every other part of the plan, including channel strategy, outreach, and content, only works if it is built around a specific and accurate picture of your best-fit customer.
Track three things: pipeline conversion rate between each funnel stage, win rate by ICP segment, and average sales cycle length. If ICP-fit deals close faster and at a higher rate than non-ICP deals, the plan is working. If the pipeline is growing but win rates are dropping, the problem is usually in lead qualification or messaging alignment between marketing and sales.
A go-to-market strategy defines what you want to achieve and why. It covers positioning, target market, and competitive approach. A go-to-market execution plan defines how you will actually do it. It covers specific channels, outreach cadences, ownership, budgets, and KPIs. Most companies are better at strategy than execution. The plan is what bridges the gap between a good idea and a result.